United States presidential elections in the District of Columbia
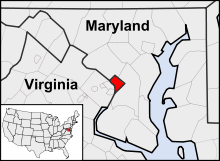
The District of Columbia is a political division coterminous with Washington, D.C., the capital city of the United States. Since the enactment of the 23rd amendment to the Constitution in 1961, the district has participated in 15 presidential elections. The amendment states that it cannot have more electoral votes than the state with the smallest number of electors. Since then, it has been allocated three electoral votes in every presidential election. The Democratic Party has immense political strength in the district. In each of the 15 presidential elections, the district has overwhelmingly voted for the Democratic candidate, with no margin less than 56.5 percentage points. It has been won by the losing candidate in 8 of the 15 elections.
 | |
| Number of elections | 15 |
|---|---|
| Voted Democratic | 15 |
| Voted Republican | 0 |
| Voted other | 0 |
| Voted for winning candidate | 7 |
| Voted for losing candidate | 8 |
In the 2000 presidential election, Barbara Lett-Simmons, an elector from the district, left her ballot blank to protest its lack of voting representation in Congress. As a result, Al Gore received only two of the three electoral votes from Washington, D.C. In 2016, 85.7% of the registered voters approved a statehood referendum. In recent times, there have been various statehood movements in the District of Columbia, which advocates making the district a state.
The district is a signatory of the National Popular Vote Interstate Compact, an interstate compact in which signatories award all of their electoral votes to the winner of the national-level popular vote in a presidential election, even if another candidate won an individual signatory's popular vote. As of 2023,[update] it has not yet gone into force.
Presidential elections
| Key for parties |
|---|
Democratic Party – (D) Green Party – (G) Independent candidate – (I) Libertarian Party – (LI) New Alliance Party – (NA) Republican Party – (R) Socialist Workers Party – (SW) |
| Year | Winner | Runner-up | Other candidate | EV | Ref. | |||||||||
|---|---|---|---|---|---|---|---|---|---|---|---|---|---|---|
| Candidate | Votes | % | Candidate | Votes | % | Candidate | Votes | % | ||||||
| Lyndon B. Johnson (D) ‡ | 169,796 | 85.5% | Barry Goldwater (R) | 28,801 | 14.5% | — | — | — | 3 | |||||
| Hubert Humphrey (D) | 139,566 | 81.82% | Richard Nixon (R) ‡ | 31,012 | 18.18% | — | — | — | 3 | |||||
| George McGovern (D) | 127,627 | 78.1% | Richard Nixon (R) ‡ | 35,226 | 21.56% | Linda Jenness (SW) | 316 | 0.19% | 3 | |||||
| Jimmy Carter (D) ‡ | 137,818 | 81.63% | Gerald Ford (R) | 27,873 | 16.51% | Peter Camejo (SW) | 545 | 0.32% | 3 | |||||
| Jimmy Carter (D) | 130,231 | 74.32% | Ronald Reagan (R) ‡ | 23,313 | 13.3% | John B. Anderson (I) | 16,131 | 9.21% | 3 | |||||
| Walter Mondale (D) | 180,408 | 85.38% | Ronald Reagan (R) ‡ | 29,009 | 13.73% | David Bergland (LI) | 279 | 0.13% | 3 | |||||
| Michael Dukakis (D) | 159,407 | 82.65% | George H. W. Bush (R) ‡ | 27,590 | 14.3% | Lenora Fulani (NA) | 2,901 | 1.5% | 3 | |||||
| Bill Clinton (D) ‡ | 192,619 | 84.64% | George H. W. Bush (R) | 20,698 | 9.1% | Ross Perot (I) | 9,681 | 4.25% | 3 | |||||
| Bill Clinton (D) ‡ | 158,220 | 85.19% | Bob Dole (R) | 17,339 | 9.34% | Ralph Nader (G) | 4,780 | 2.57% | 3 | |||||
| Al Gore (D) | 171,923 | 85.16% | George W. Bush (R) ‡ | 18,073 | 8.95% | Ralph Nader (G) | 10,576 | 5.24% | 2 | |||||
| John Kerry (D) | 202,970 | 89.18% | George W. Bush (R)‡ | 21,256 | 9.34% | Ralph Nader (I) | 1,485 | 0.65% | 3 | |||||
| Barack Obama (D)‡ | 245,800 | 92.46% | John McCain (R) | 17,367 | 6.53% | Ralph Nader (I) | 1,138 | 0.43% | 3 | |||||
| Barack Obama (D)‡ | 267,070 | 90.91% | Mitt Romney (R) | 21,381 | 7.28% | Jill Stein (G) | 2,458 | 0.84% | 3 | |||||
| Hillary Clinton (D) | 282,830 | 90.86% | Donald Trump (R)‡ | 12,723 | 4.09% | Gary Johnson (LI) | 4,906 | 1.58% | 3 | |||||
| Joe Biden (D)‡ | 317,323 | 92.15% | Donald Trump (R) | 18,586 | 5.4% | Jo Jorgensen (LI) | 2,036 | 0.59% | 3 | |||||
Graph
The following graph shows the margin of victory of the Democratic Party over the Republican Party in the 15 presidential elections the District of Columbia participated.
See also
Notes
References
Works cited
- Guide to U.S. Elections. SAGE Publications. 2010. ISBN 978-1-60426-536-1.
- Presidential elections, 1789–1996. Congressional Quarterly. 1997. ISBN 978-1-56802-065-5. LCCN 97019084. OL 673017M.